Prism cruising with your phone – variable radius plots in Arboreal Forest
Johan Ekenstedt
1 Oct 2026
Variable radius plots – also called prism cruising, point sampling or angle-count sampling – are one of the most common ways to measure a forest. With the latest version of Arboreal Forest you can do the whole plot digitally on your phone, from the tree count with the prism to the diameter and height of the sample trees.
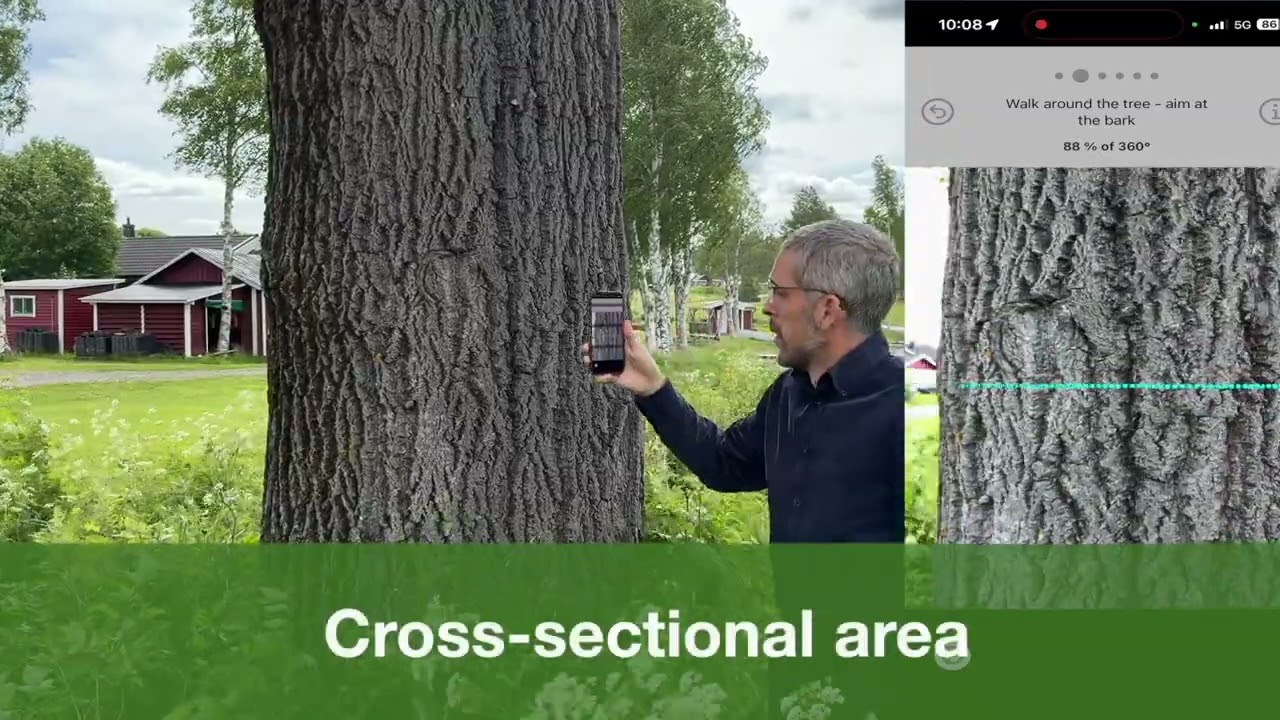
In the app the feature is called Prism. The video above shows a complete plot, step by step.
What you see in the video
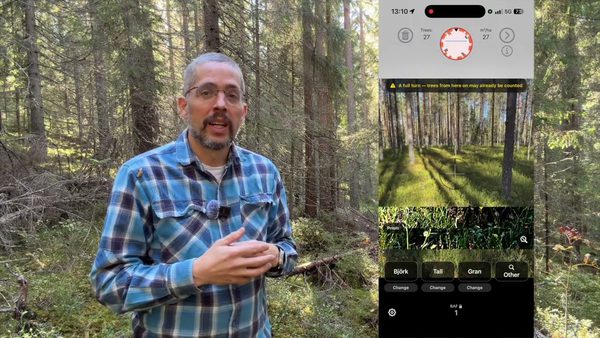
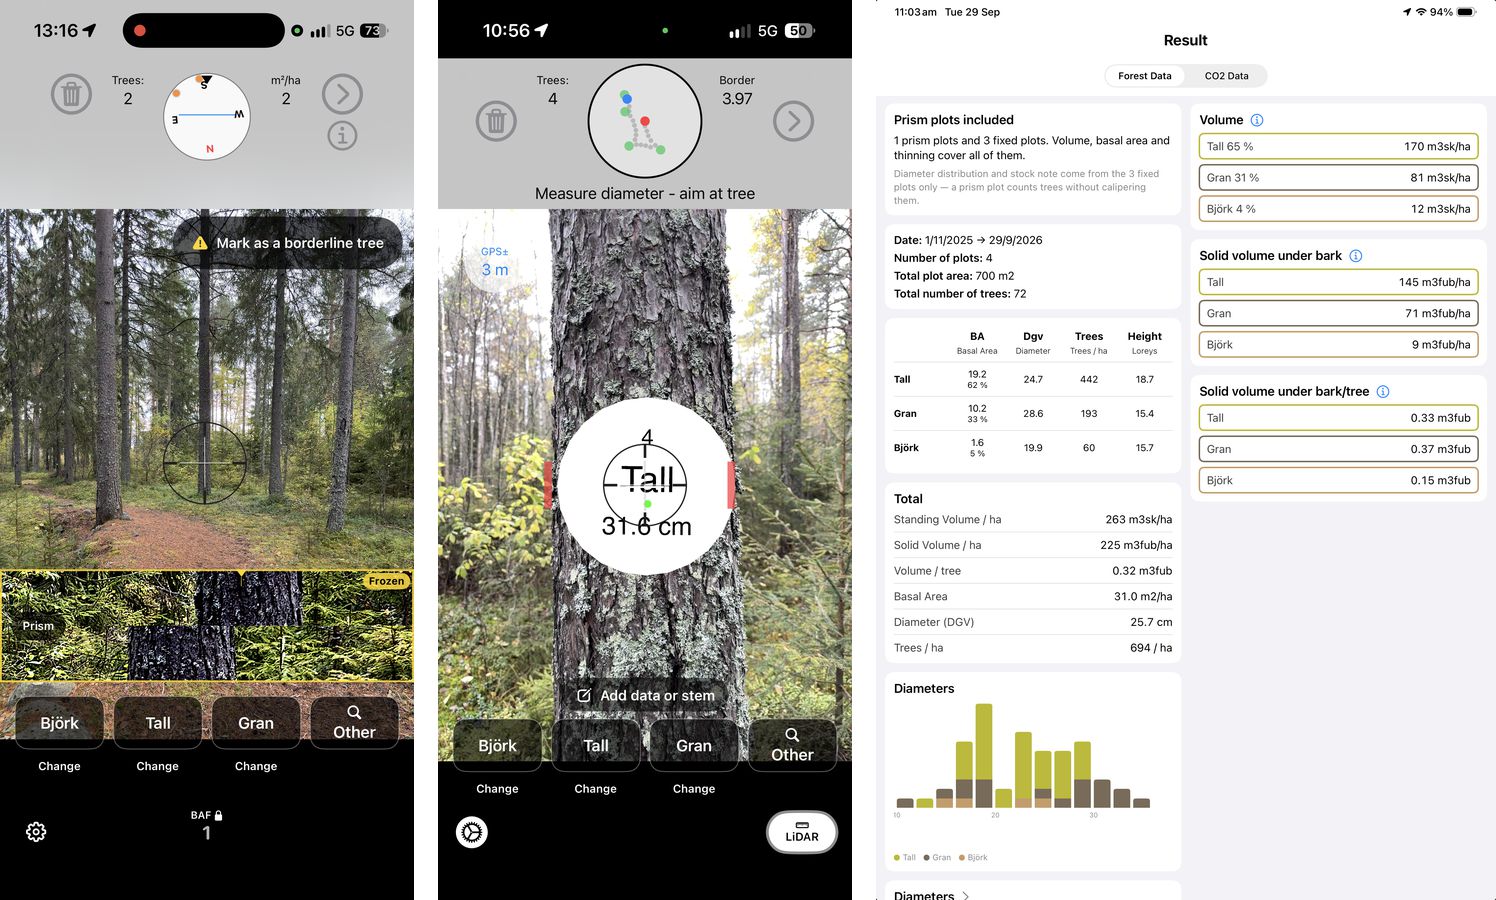
- Tree count with the digital prism. Mark the plot centre, hold the phone above it and turn a full circle. The screen shows the prism in a small view and the surroundings in a larger view. If the trunk overlaps in the prism, the tree is counted. Tap the screen to freeze the view and zoom in on close calls. The prism corrects for slope automatically, so just aim at breast height on each tree.
- Borderline trees. Long-press to mark a borderline tree. The app reminds you to measure its diameter later, and then tells you if the tree is in or out.
- Sample trees with Big BAF. After the full turn you select the sample trees with a larger basal area factor (Big BAF), usually 10–15 times the count BAF.
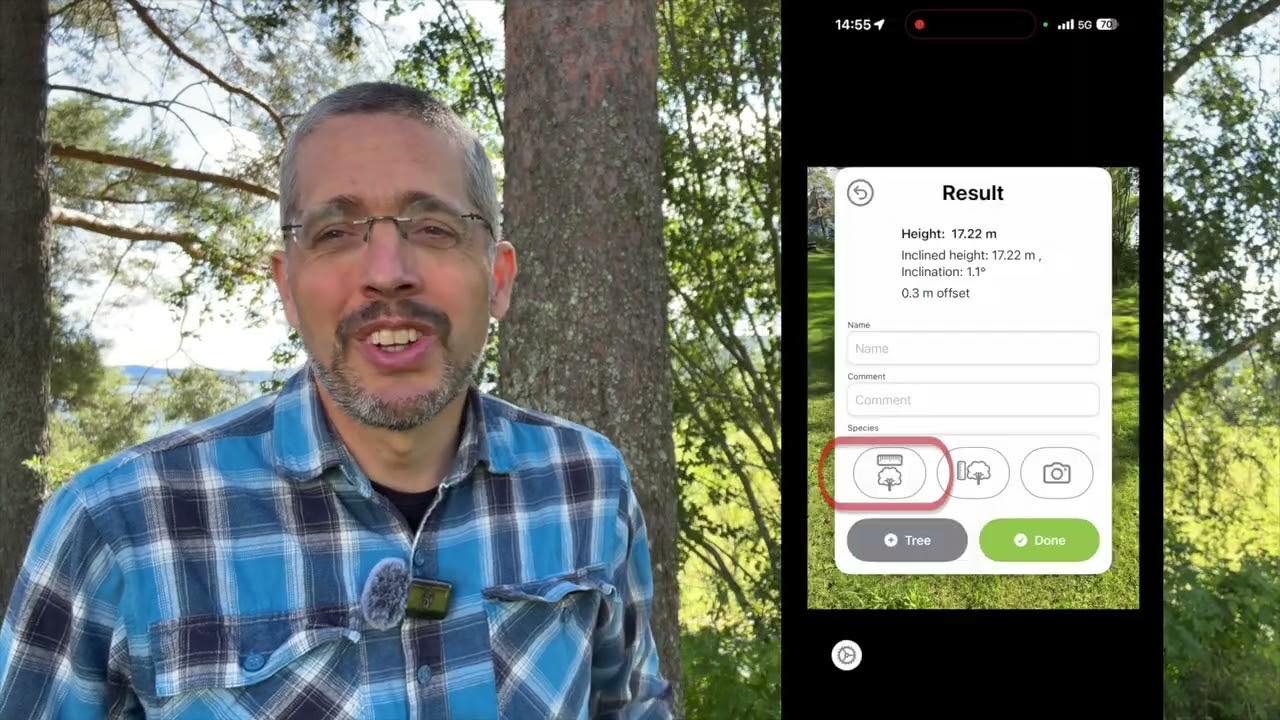
- Diameter and height. Measure diameter at breast height and tree height on the sample trees, with guidance on the screen. The app warns you if a tree is too small to be a borderline or sample tree.
- Summary. When you are done you get a summary with all the data from the plot.
Why prism plots?
- They are fast. You don't lay out a plot boundary and you don't measure every tree. Counting the trees takes a minute or two.
- Large trees count the most. A tree is counted at a distance that grows with its diameter, so the large trees – which hold most of the volume and value – are sampled more often than the small ones.
- More plots in the same time. The largest source of error in a forest inventory is usually the variation between plots, not the measurement of each tree. When each plot is quick, you can measure more plots and cover the stand better.
- An estimate of the uncertainty. When you measure several plots you also get an estimate of the uncertainty of the result.
- No extra gear. No prism, relascope, measuring tape, caliper or height meter – your phone is enough.
Prism plots are best for basal area and volume. If you need trees per hectare or a diameter distribution, fixed plots are better. You can combine both in the same stand: Arboreal Forest calculates volume and basal area from all the plots, and the diameter distribution from the fixed plots only.
Why sample trees with Big BAF?
Volume per hectare = basal area per hectare × volume per basal area
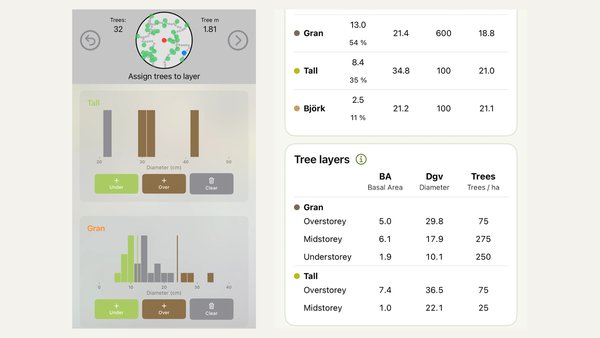
The basal area varies a lot from plot to plot, while the volume per basal area varies much less within a stand. So it pays off to count trees on many plots and to measure diameter and height on only a few. With Big BAF you choose the sample trees with a larger basal area factor, which gives one or a few trees per plot. They are chosen with the same rule as the count, so the choice is objective and the sample trees are spread over the whole stand. Use the same Big BAF throughout the stand. The method is described by Marshall, Iles and Bell (2004) in the Canadian Journal of Forest Research.
Why a prism and not a relascope?
There are two classic tools for angle-count sampling: the relascope, where you compare the trunk with a gauge, and the wedge prism, which shifts the image of the trunk. We have chosen the prism for Arboreal Forest because it is more exact:
- You only have to see if two parts overlap. With a relascope you compare the width of the trunk with the width of the gauge. With a prism you look at one edge – do the two parts of the trunk still overlap? With the digital prism you can also freeze the image and zoom in.
- The prism is the plot centre. You hold the phone over the plot centre and turn around it, so the centre stays in the same place during the whole count. If you are used to a relascope, this is the biggest change: it is the phone, not you, that should be in the centre.
How accurate is it?
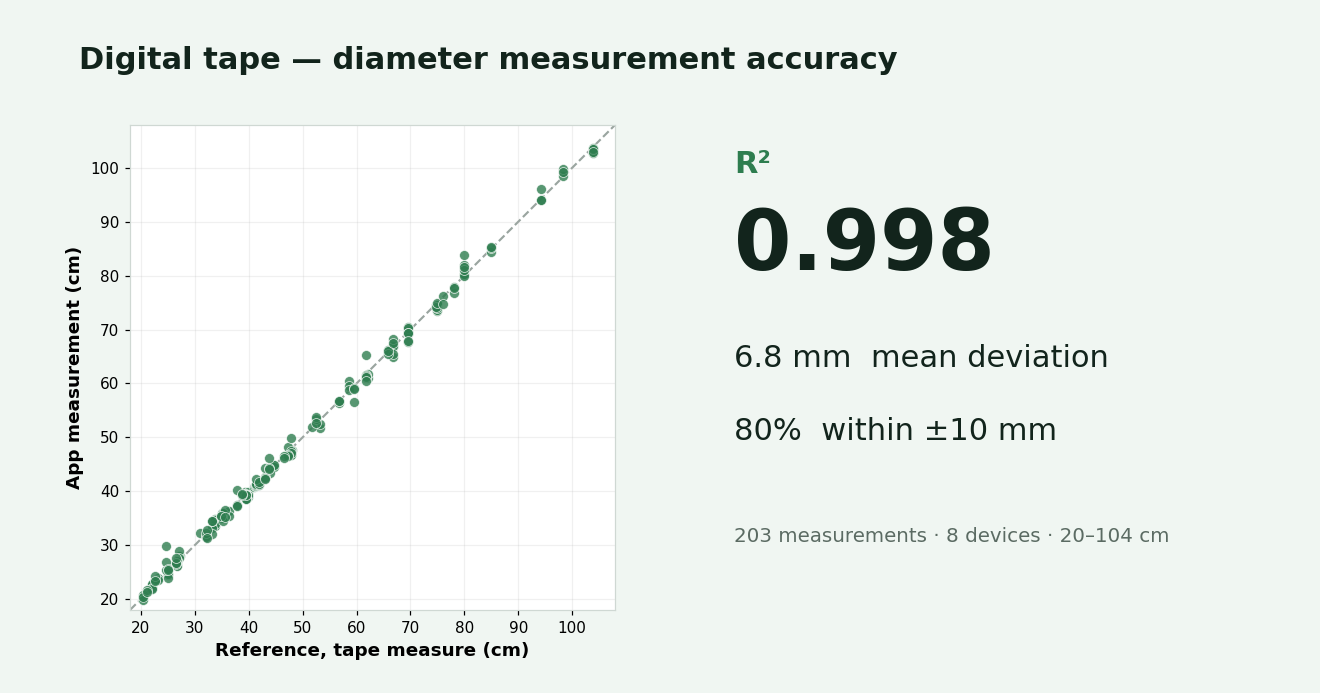
The diameter and height of the sample trees are measured in the same way as in fixed plots, so they have the same accuracy. You can read about our evaluations on the Arboreal Forest page.
Our preliminary tests show that the digital prism is very exact when it decides whether a tree should be counted or not. We will publish a full evaluation of the prism plots when it is ready.
Try it
Prism plots are available in the latest version of Arboreal Forest on the App Store. Read more on the Arboreal Forest page, and send me an email if you have questions or feedback.
Written by

Johan Ekenstedt
CEO and iOS developer at Arboreal. Making it easier to measure, understand and manage trees and forests.
LinkedIn